Gallery
Due to confidentiality obligations, I cannot disclose all projects I have worked on; however, I am pleased to share some non-sensitive examples that showcase my skills and experience.

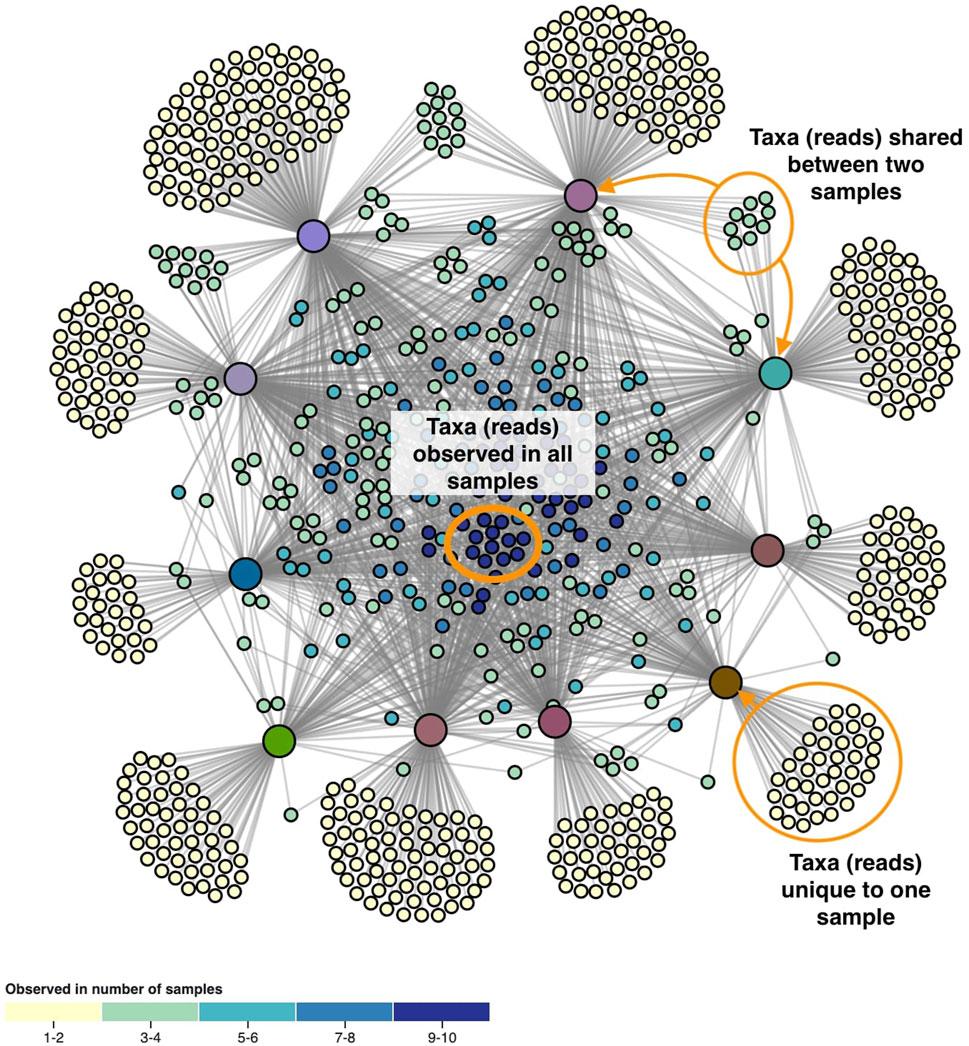
Snowflake: visualizing microbiome abundance tables as multivariate bipartite graphs
Current visualizations in microbiome research rely on aggregations in taxonomic classifications or do not show less abundant taxa. We introduce Snowflake: a new visualization method that creates a clear overview of the microbiome composition in collected samples without losing any information due to classification or neglecting less abundant reads. Snowflake displays every observed OTU/ASV in the microbiome abundance table and provides a solution to include the data’s hierarchical structure and additional information obtained from downstream analysis (e.g., alpha- and beta-diversity) and metadata.

Data Driven Web Design
As a data visualization specialist offering my services, I've seamlessly integrated the art of visualizing information into the design of my website. To honor Edward Tufte, a founding father of data visualization, I've chosen to digitally recreate the cover image from his seminal work, "The Visual Display of Quantitative Information," using it as the background for the website's landing page.

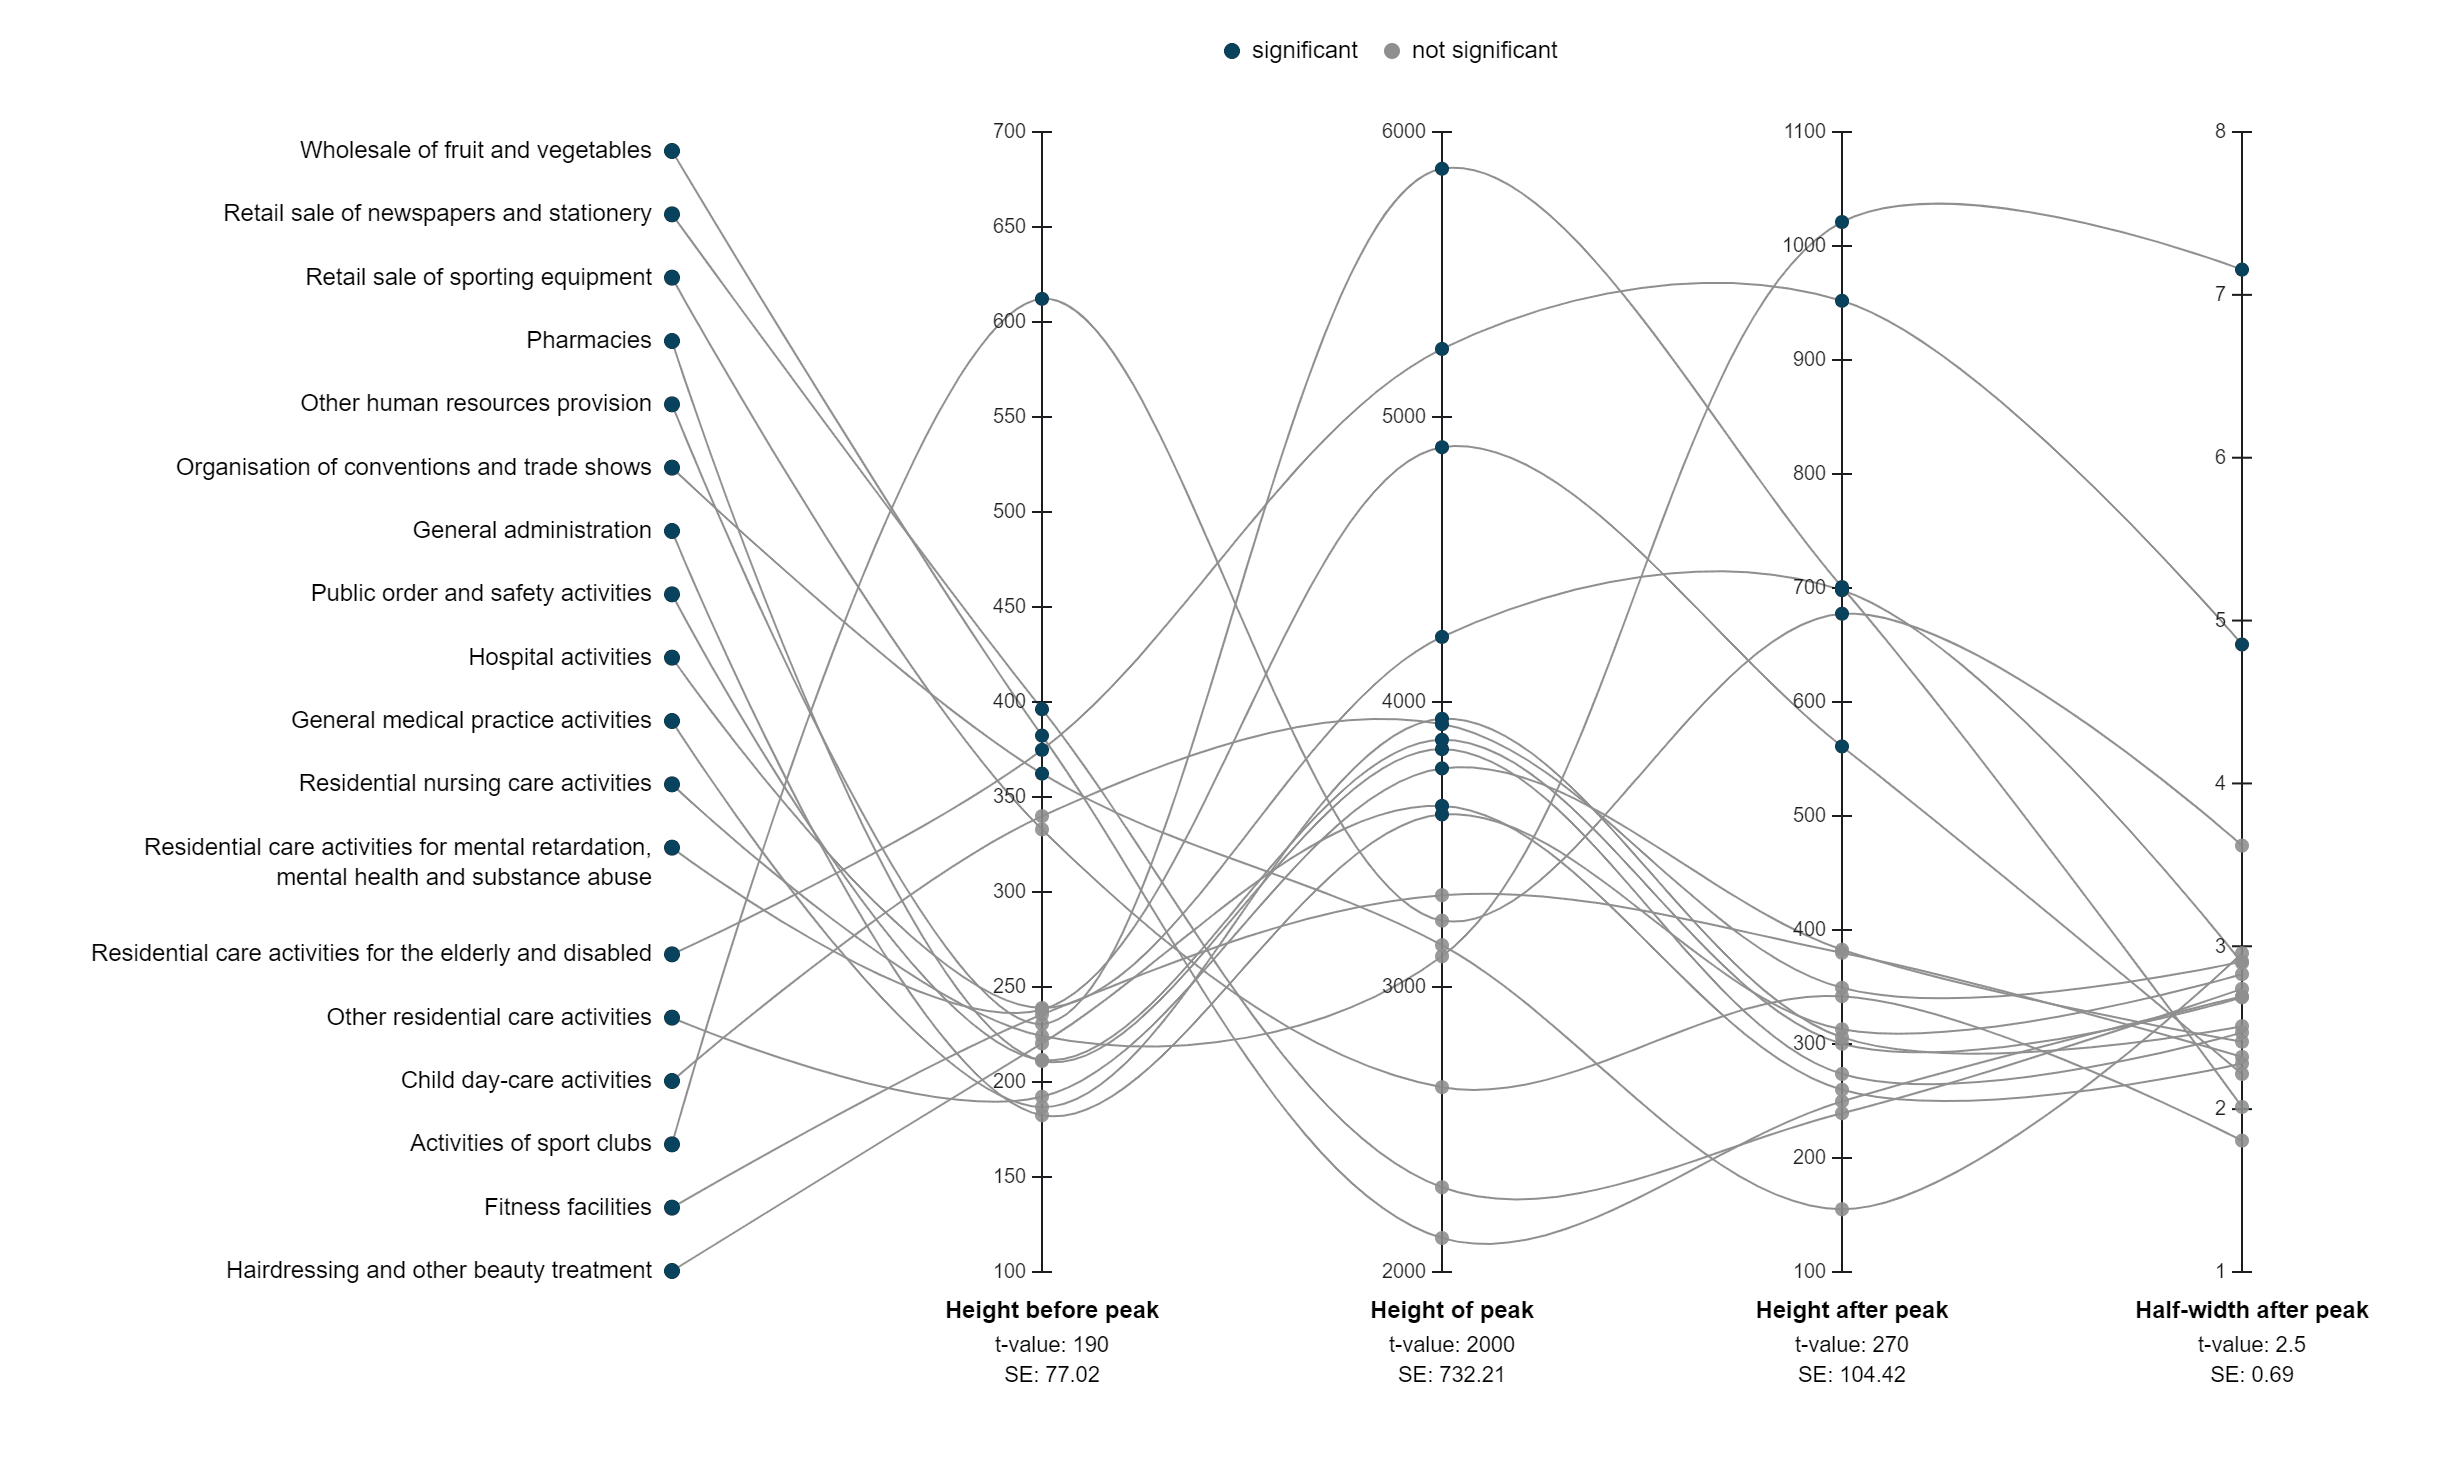
Confirmed COVID-19 Cases per Economic Activity during Autumn Wave in Belgium
Some occupational sectors, such as human health and care, food service, cultural and sport activities, have been associated with a higher risk of SARS-CoV-2 infection than other sectors. To assess the effectiveness of applying targeted non-pharmaceutical interventions on these specific 'high risk sectors', rather than inducing a full lockdown, Johan Verbeeck and his collegues at Hasselt University studied COVID-19 incidence per economic activity during the autumn 2020 wave in Belgium.

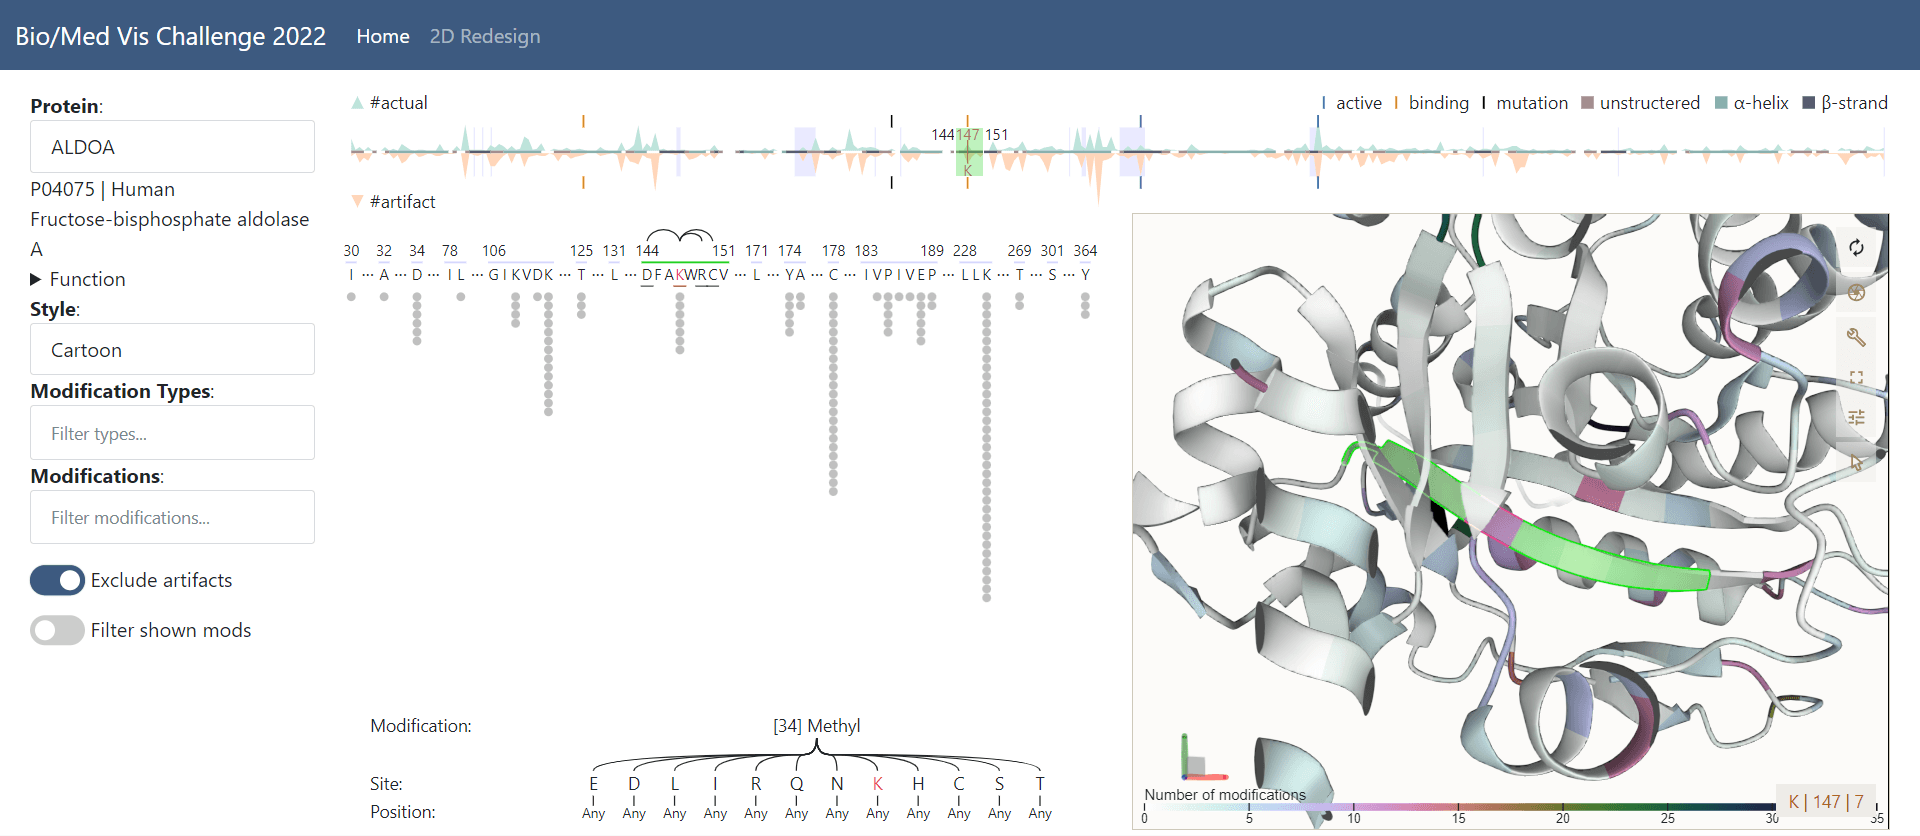
EProM-Exploration of Protein Modifications
Here, I present EProM a visual analysis interface for the exploration of protein modifications &mdash as a contribution to the IEEE VIS 2022 Bio+MedVis Challenge, awarded for Best Challenge Entry. The interface targets researchers in biochemistry, proteomics, and precision medicine as its primary users. Observed modifications can be inspected from the protein’s primary, secondary, and tertiary structure, using a straightforward design and intuitive interactions. Modifications’ measurement uncertainty and relation to residues with identified pathogenic mutations are considered.
